
No items found.
Content of
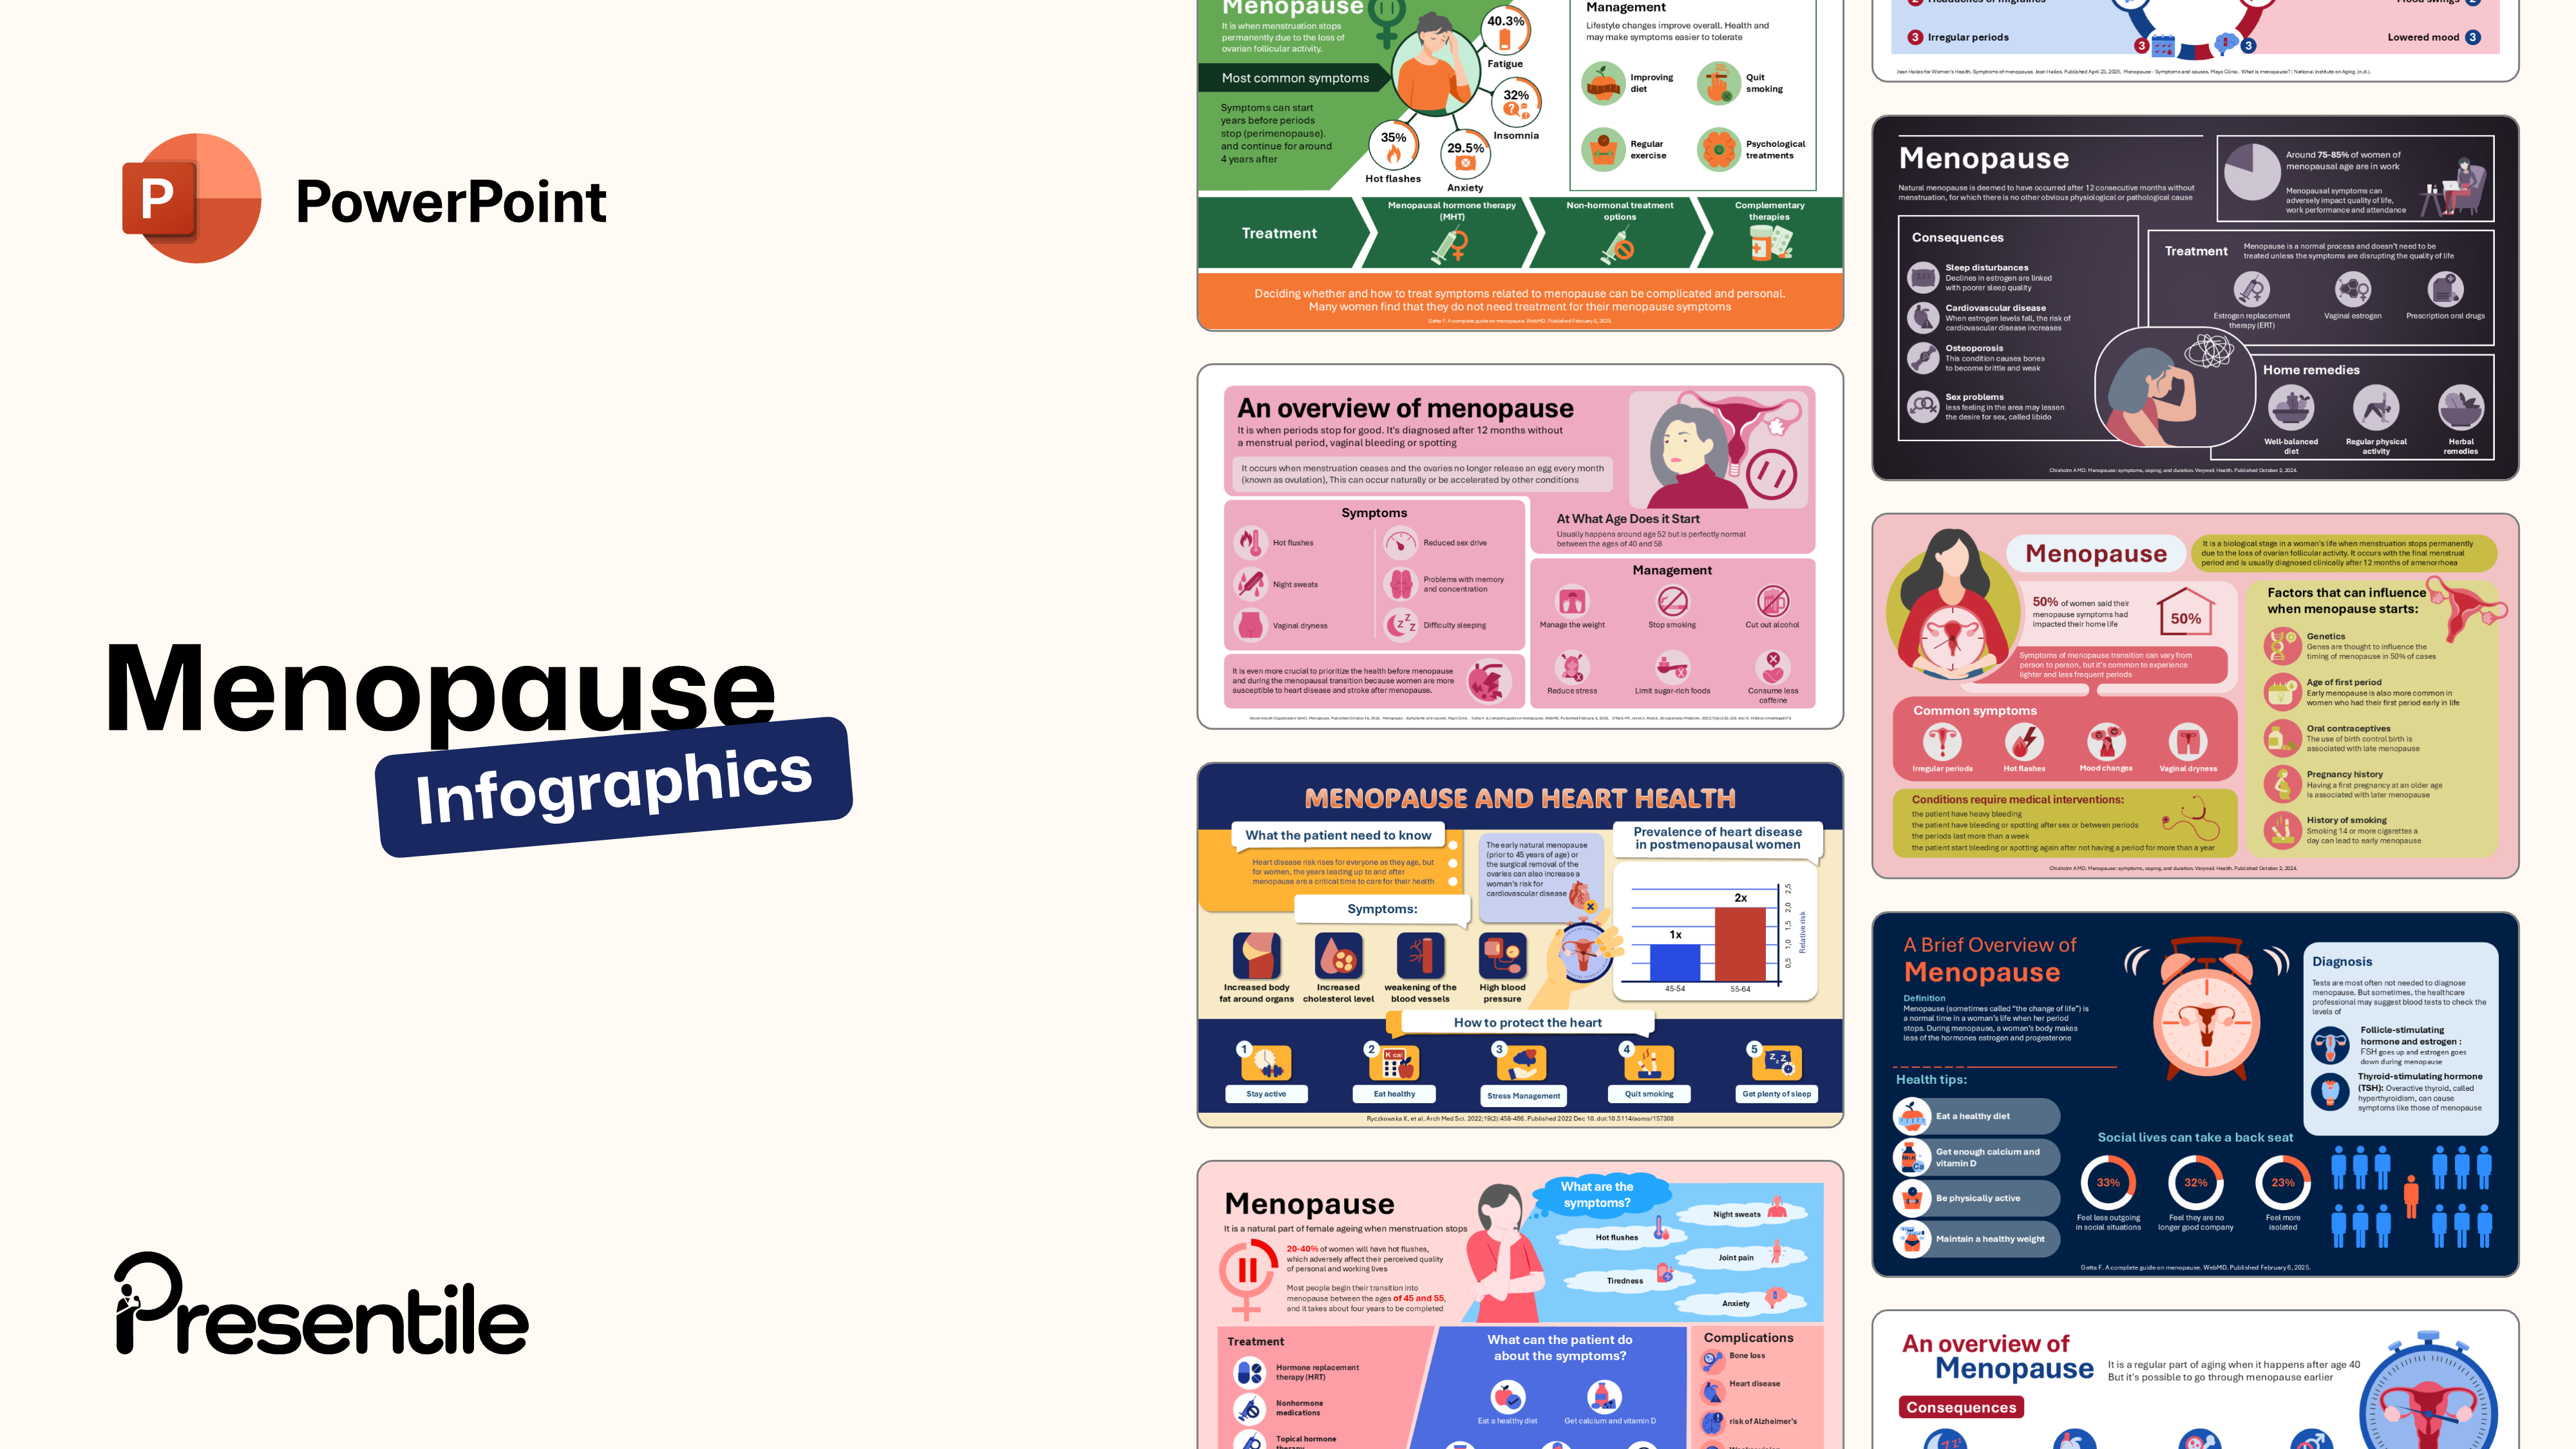
Menopause PowerPoint Infographic
Infographic 1: Menopause and Heart Health Key Risks, Symptoms, and Prevention Tips for Women

- This infographic explains how menopause impacts heart health, highlighting common symptoms, increased cardiovascular risks, and essential lifestyle changes for prevention.
- Visually, it features a clean, structured layout with icons, a bar graph, and color-coded sections that make the medical information easy to digest and engaging.
Infographic 2: Understanding Menopause Symptoms, Complications, and Common Misconceptions

- This infographic outlines the key symptoms and complications of menopause, while debunking common myths about its causes and highlighting statistics on women's experiences.
- The design uses a balanced mix of icons, bold typography, and segmented sections to clearly present medical facts in an accessible and visually engaging format.
Infographic 3: Menopause Overview Symptoms, Onset Age, and Effective Management Strategies

- This infographic provides a comprehensive overview of menopause, including its definition, common symptoms, typical onset age, and recommended management techniques to support long-term health.
- The visual layout is clean and informative, using bullet points, icons, and sectioned content to clearly guide the reader through each aspect of the menopause transition
Infographic 4: Hormone Therapy for Menopause Types, Risks, and When to Avoid It

- This infographic explains the different forms of hormone therapy used to manage menopause symptoms, outlines who should avoid it, and highlights potential side effects.
- The visuals use clear icons, concise bullet points, and a structured layout to make complex medical information easy to understand at a glance.
Infographic 5: Menopause Explained Causes, Symptoms, and Simple Health Tips

- This infographic defines menopause, outlines its hormonal causes, and highlights common symptoms along with practical lifestyle tips for better health during the transition.
- The design features a central illustration, clean typography, and a structured layout that makes the information visually appealing and easy to follow.
Infographic 6: Menopause Symptoms, Treatments, and Self-Care

- This infographic offers a detailed overview of menopause, including common symptoms, treatment options, patient self-care strategies, and potential complications.
- The layout is well-organized with clearly labeled sections, icons, and a professional presentation style that enhances readability and visual appeal.
Infographic 7: Menopausal Hormone Therapy (MHT) Benefits, Risks, and Safe Usage Guidelines
%20Benefits%2C%20Risks%2C%20and%20Safe%20Usage%20Guidelines.PNG)
- This infographic provides a comprehensive overview of Menopausal Hormone Therapy (MHT), explaining its role in alleviating symptoms like hot flushes, mood swings, and vaginal dryness.
- It outlines the different delivery methods—tablets, patches, gels, and vaginal applications—alongside safety considerations, such as when to start, potential risks like breast cancer and blood clots, and guidance on when to discontinue use.
- Visually, the infographic adopts a clean, slide-deck format with soft pastel tones and a structured layout. It uses icons to represent symptoms and treatment types, bold section headers for easy navigation, and a balanced mix of text and visuals that make the medical content approachable and easy to scan.
Infographic 8: Menopause Overview Physical, Psychological, and Long-Term Health Effects

- This infographic offers a broad overview of menopause, highlighting its typical onset, physical and psychological symptoms, and long-term health consequences such as cardiovascular disease and osteoporosis.
- Visually, it features a central anatomical diagram of the female reproductive system, surrounded by icon-based symptom clusters and a clean, slide-style layout that enhances clarity and educational value.
Infographic 9: Menopause Transition Symptoms, Medical Indicators, and Influencing Factors

- This infographic explores the menopause transition in depth, highlighting common symptoms such as irregular periods, hot flashes, mood changes, and vaginal dryness, while also identifying when medical evaluation is necessary—particularly in cases of prolonged amenorrhea or unexpected postmenopausal bleeding. It also outlines key factors that influence the timing of menopause, including genetics, age of first menstruation, ovarian reserve, pregnancy history, and smoking habits.
- Visually, the infographic uses a structured, educational layout with a balance of text and icons. It features a clean background with accent colors to differentiate sections, bullet-point formatting for clarity, and a central statistic ("50% of women said their menopause symptoms had a negative impact on their lives") that draws immediate attention. The design is optimized for both readability and visual engagement, making complex health information accessible and easy to navigate.
Infographic 10: Menopause Symptoms, Management, and Treatment Options

- This infographic outlines the biological basis of menopause and presents a data-driven look at its most common symptoms—such as hot flashes (35%), fatigue (40.3%), insomnia (32.9%), and anxiety (25.7%)—while emphasizing the importance of lifestyle changes and individualized treatment decisions. It also categorizes management strategies into lifestyle adjustments, psychological support, hormone therapy, and alternative treatments, acknowledging that many women may not require medical intervention.
- Visually, the infographic is styled as a professional presentation slide with a clean, minimalistic layout. It uses percentage-based data points to highlight symptom prevalence, supported by bullet-point lists and section headers that clearly separate symptoms, management, and treatment. The design is structured for clarity, making it ideal for educational or clinical use.
Infographic 11: Menopause Explained Symptoms, Workplace Impact, and Treatment Options

- This infographic defines natural menopause and explores its broader implications, including its prevalence among working women and its impact on sleep, cardiovascular health, bone density, and sexual wellness. It outlines both clinical treatments—like estrogen replacement therapy and vaginal estrogen—and home remedies such as diet, exercise, and herbal approaches, emphasizing that treatment is often only necessary when symptoms affect quality of life.
- Visually, the infographic is styled as a professional presentation slide with a soft color palette and a central illustration of a woman experiencing discomfort, symbolizing menopausal symptoms. It uses clearly labeled sections, bullet points, and concise statistics to guide the viewer through the content, making it ideal for educational or workplace wellness settings.
Infographic 12: Menopause Causes, Symptoms, and Workplace Impact A Comprehensive Breakdown

- This infographic categorizes menopause into natural, premature, and induced types, and explores its wide-ranging effects—from physical symptoms like hot flashes and urinary issues to psychological challenges such as anxiety and forgetfulness. It also highlights the social stigma surrounding menopause in the workplace, with nearly half of affected women reporting negative impacts on their job performance and reluctance to disclose the real reason for taking time off.
- Visually, the infographic is styled as a professional slide with a clean, segmented layout. It uses bold headers to separate causes, epidemiology, and symptoms, and includes percentage-based statistics to emphasize the real-world impact. The design is minimal yet informative, making it suitable for educational, clinical, or corporate wellness presentations.
Infographic 13: Understanding Menopause Hormonal Changes, Symptoms, and Risk Factors

- This infographic provides a concise yet informative overview of menopause, explaining its biological definition, average onset age, and common symptoms such as brain fog, mood changes, and sleep disturbances. It also highlights the importance of evaluating postmenopausal bleeding and outlines key risk factors for early menopause, including smoking, ovary removal, and cancer treatments.
- Visually, the infographic uses a clean, clinical layout with soft color accents and clearly divided sections. It features bullet-pointed symptom lists, a bolded statistic on average menopause age, and a focused callout on postmenopausal bleeding, making it both educational and easy to navigate for patients and healthcare audiences alike.
Infographic 14: Stages and Body Changes in Menopause: From Perimenopause to Postmenopause

- This infographic outlines the three key stages of menopause—perimenopause, menopause, and postmenopause—while highlighting common symptoms such as hot flashes, mood swings, and joint pain. It also details how menopause affects various parts of the body, including thinning hair, drier skin, bone density loss, and changes in breast and reproductive organ health, emphasizing when medical attention is needed.
- Visually, the infographic is styled as a clean, educational slide with a structured layout that separates stages, symptoms, and body changes into distinct sections. It uses soft color blocks, bold headers, and anatomical references to enhance clarity and engagement, making it ideal for patient education or health awareness campaigns
Infographic 15: What Happens During Menopause? Stages, Symptoms, and Joint Health Tips

- This infographic breaks down the three stages of menopause—perimenopause, menopause, and postmenopause—while highlighting the wide range of 34 recognized symptoms, including hot flashes, insomnia, and forgetfulness. It also presents a key statistic showing that over half of women experience at least one severe symptom that impacts their quality of life, and offers practical advice for maintaining joint health through exercise and nutrition.
- Visually, the infographic is styled as a professional presentation slide with a structured, multi-section layout. It features medical illustrations such as ovaries, symptom icons, and a woman experiencing hot flashes, all set against a clean background with clear typography. The design effectively balances educational content with visual storytelling, making it ideal for health education and awareness campaigns.
Infographic 16: Menopause Diagnosis, Symptoms, and Global Impact

- This infographic provides a comprehensive overview of menopause, including its typical onset age, diagnostic hormone tests (FSH, estradiol, and thyroid), and common symptoms like night sweats, sore breasts, and chills. It also addresses the global prevalence of postmenopausal women, clarifies causes of postmenopausal bleeding, and emphasizes the link between hormone levels and heart health.
- Visually, the infographic is styled as a professional slide with a multi-section layout that combines medical illustrations (e.g., thyroid gland, hormone diagrams), a pie chart for global statistics, and icon-based symptom lists. The design uses a clean, educational format with color-coded sections that enhance readability and make complex health information accessible for a wide audience.
Infographic 17: What Is Menopause? Causes, Complications, and Workplace Impact

- This infographic defines menopause as a life stage marking the end of reproductive function and outlines its causes—including natural hormonal decline, ovary removal, cancer treatments, and primary ovarian insufficiency. It also highlights serious complications such as heart disease, osteoporosis, and bladder issues, while presenting workplace statistics showing that menopause can significantly affect women's careers, with 43% quitting and 23% reducing hours due to symptoms.
- Visually, the infographic uses a structured, educational layout with bold section headers and icon-enhanced lists. It features a clean, professional design with a balance of text and visuals, including data points, health tips, and medical illustrations, making it ideal for awareness campaigns and workplace wellness programs.
Infographic 18: Menopause Hormone Therapy (MHT) When to Start, Benefits, and Treatment Options
%20When%20to%20Start%2C%20Benefits%2C%20and%20Treatment%20Options.PNG)
- This infographic explains the role of Menopause Hormone Therapy (MHT) in managing disruptive symptoms such as night sweats, vaginal dryness, and urinary urgency. It outlines when to consider starting MHT—especially in cases of early or surgical menopause—and emphasizes its benefits for bone and heart health when initiated within 10 years of menopause. It also details the three main delivery methods: tablets, patches, and vaginal creams, each with specific uses and risk profiles.
- Visually, the infographic is presented in a clean, slide-style format with pastel color accents and icon-enhanced sections. It uses a structured layout to separate symptoms, benefits, timing, and treatment types, making the information easy to follow and ideal for patient education or clinical settings.
Infographic 19: A Brief Overview of Menopause Hormonal Changes, Diagnosis, and Lifestyle Tips

- This infographic introduces menopause as a natural life stage marked by a decline in estrogen and progesterone, and outlines key health tips such as maintaining a balanced diet, staying active, and ensuring adequate calcium and vitamin D intake. It also highlights the social impact of menopause, with statistics showing reduced social engagement, and explains how diagnosis is typically clinical, with occasional hormone testing to rule out thyroid-related conditions.
- Visually, the infographic features a symbolic illustration of an alarm clock with gears to represent internal hormonal shifts, alongside clean iconography for health tips and social statistics. The layout is structured and approachable, making it ideal for HCP education and public health awareness.
Infographic 20: Menopause Timeline, Risk Factors, and the Role of Hormone Therapy

- This infographic explains menopause as a natural biological process typically occurring between ages 45 and 55, lasting around seven years, and influenced by factors such as genetics, early menstruation, and contraceptive use. It also outlines risk factors like ovary removal and cancer treatments, and highlights Menopausal Hormone Therapy (MHT) as the most effective symptom relief method when started within a decade of onset.
- Visually, the infographic is presented in a clean, slide-style format with a structured layout that separates causes, risk factors, and treatment guidance. It uses bullet points, bold headers, and a soft color palette to enhance readability, making it ideal for educational presentations and patient resources.
Features of
Menopause PowerPoint Infographic
- Fully editable in PowerPoint
- All graphics are in vector format
- Medically Referenced information and data
Specifications
 Slides count:
 Compatible with:Microsoft PowerPoint
 File type:PPTX
 Dimensions:16:9
Files Included
- Non-animated PowerPoint
- Animated PowerPoint File
- Animated PowerPoint with Voice Over
- PDF Documents with presentation script
Elevate Your Work with Our Innovative Slides
Thank you! Your submission has been received!
Oops! Something went wrong while submitting the form.
No items found.