No items found.
Content of
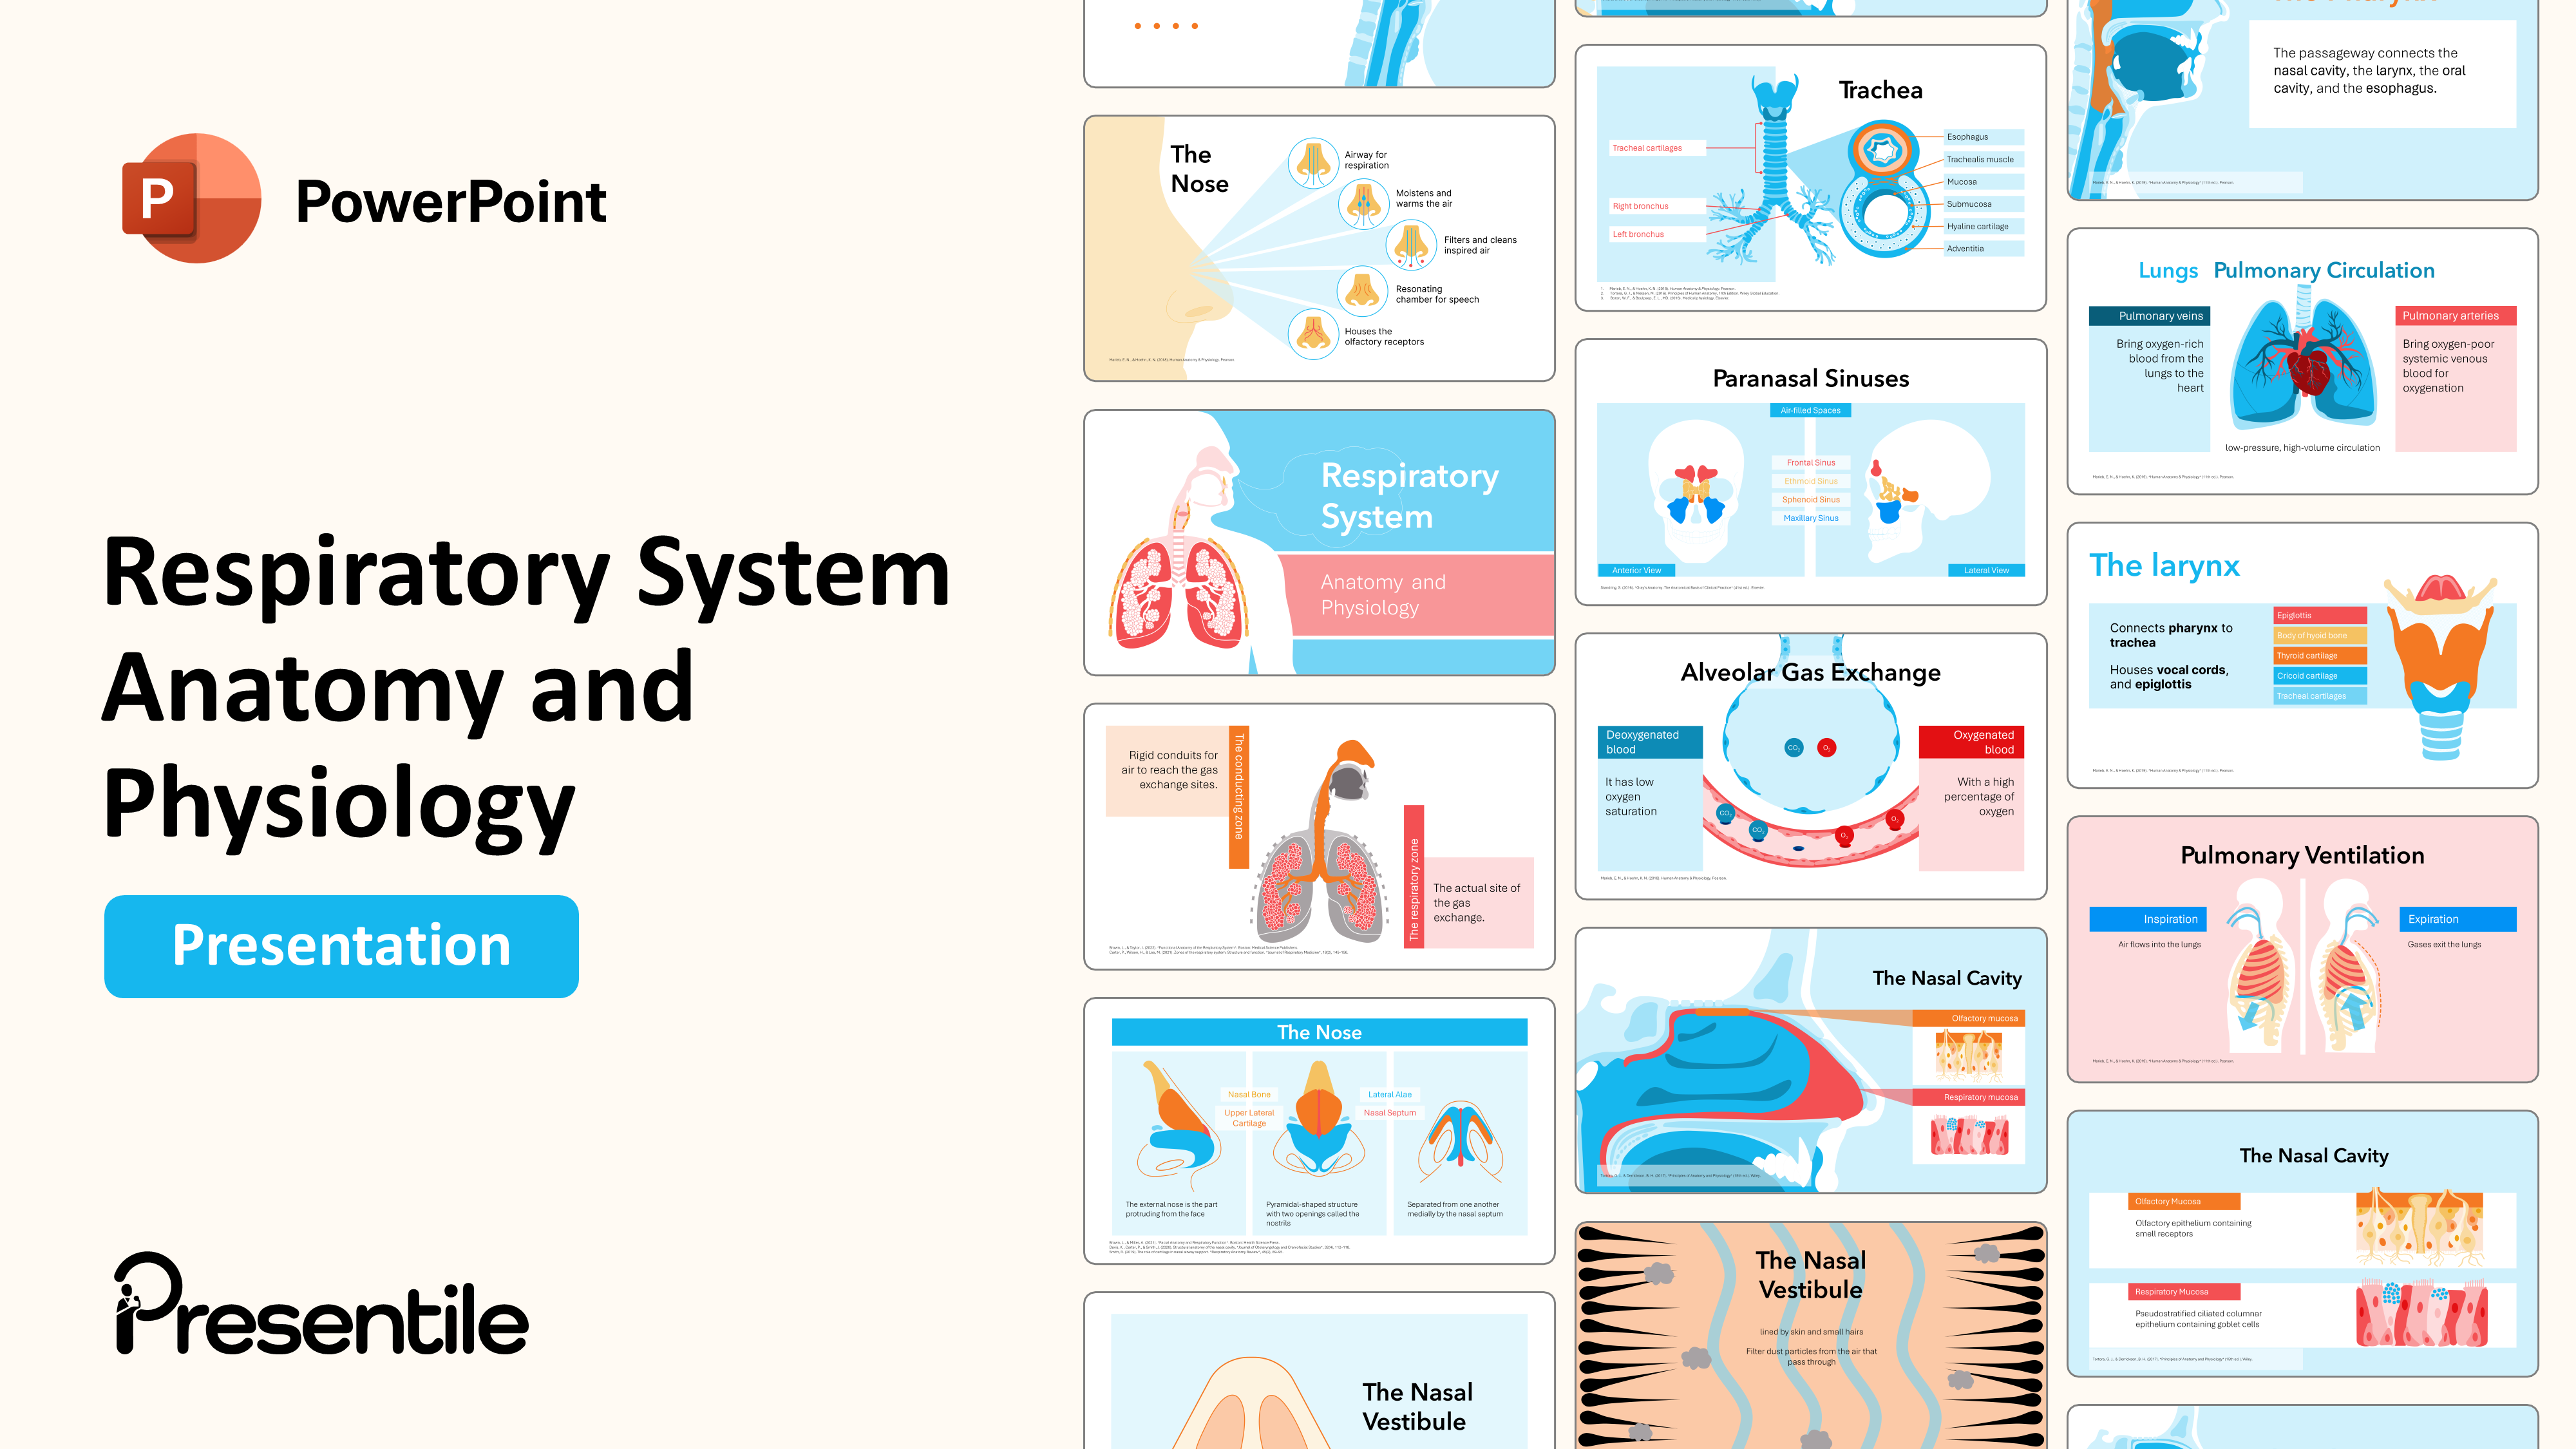
Introduction to Anemia PowerPoint Presentation
Slide 1: Anemia Cover Slide

- Anemia is an important health concern that requires proper diagnosis and treatment to prevent complications.
- This visually engaging slide is specifically structured for seamless integration with your introductory voice-over, making it ideal for setting the stage in medical lectures, healthcare training sessions, or patient education materials for a polished and focused beginning.
Slide 2: Section Slide What is Anemia?

- This slide is titled What is anemia? With a red background.
Slide 3: Definition of Anemia

- Anemia is a deficiency in either the number of red blood cells or the amount of hemoglobin (the oxygen-carrying protein) within those cells.
- visually defines Anemia with a large, stylized red blood drop filled with numerous red blood cells, contrasting with a larger, empty white blood drop outline, positioned next to a silhouette of a person, and accompanied by text.
Slide 4: Key Indicators—Hemoglobin, Hematocrit, and RBC Count for Anemia

- Anemia involves a decrease in hemoglobin; hematocrit, and the overall red blood cell count itself. These reductions can have various causes and lead to a range of symptoms, depending on their severity and underlying reason.
- visually illustrate three circular red icons listing Hemoglobin (Hb) with a representation of hemoglobin molecules, Hematocrit (HCT) with a depiction of separated blood components showing a low red blood cell volume, and RBC count with a visual of fewer red blood cells.
Slide 5: Global Prevalence of Anemia

- affecting 1.6 billion people worldwide—representing 24% of the world’s population. The burden is highest among vulnerable groups, with 41.8% of pregnant women impacted. These WHO-endorsed statistics for anemia underscore the urgent need for targeted interventions.
- This professional medical PowerPoint template slide offers a clear and impactful look at global anemia statistics.
- Featuring a central graphic representing 1.6 Billion people globally affected, alongside data callouts for 47.4% prevalence in preschool children and 41.8% in pregnant women, this editable layout provides a visually strong presentation for clinical discussions and public health summaries.
Slide 6: The 4 Main Components of Blood and Their Vital Functions
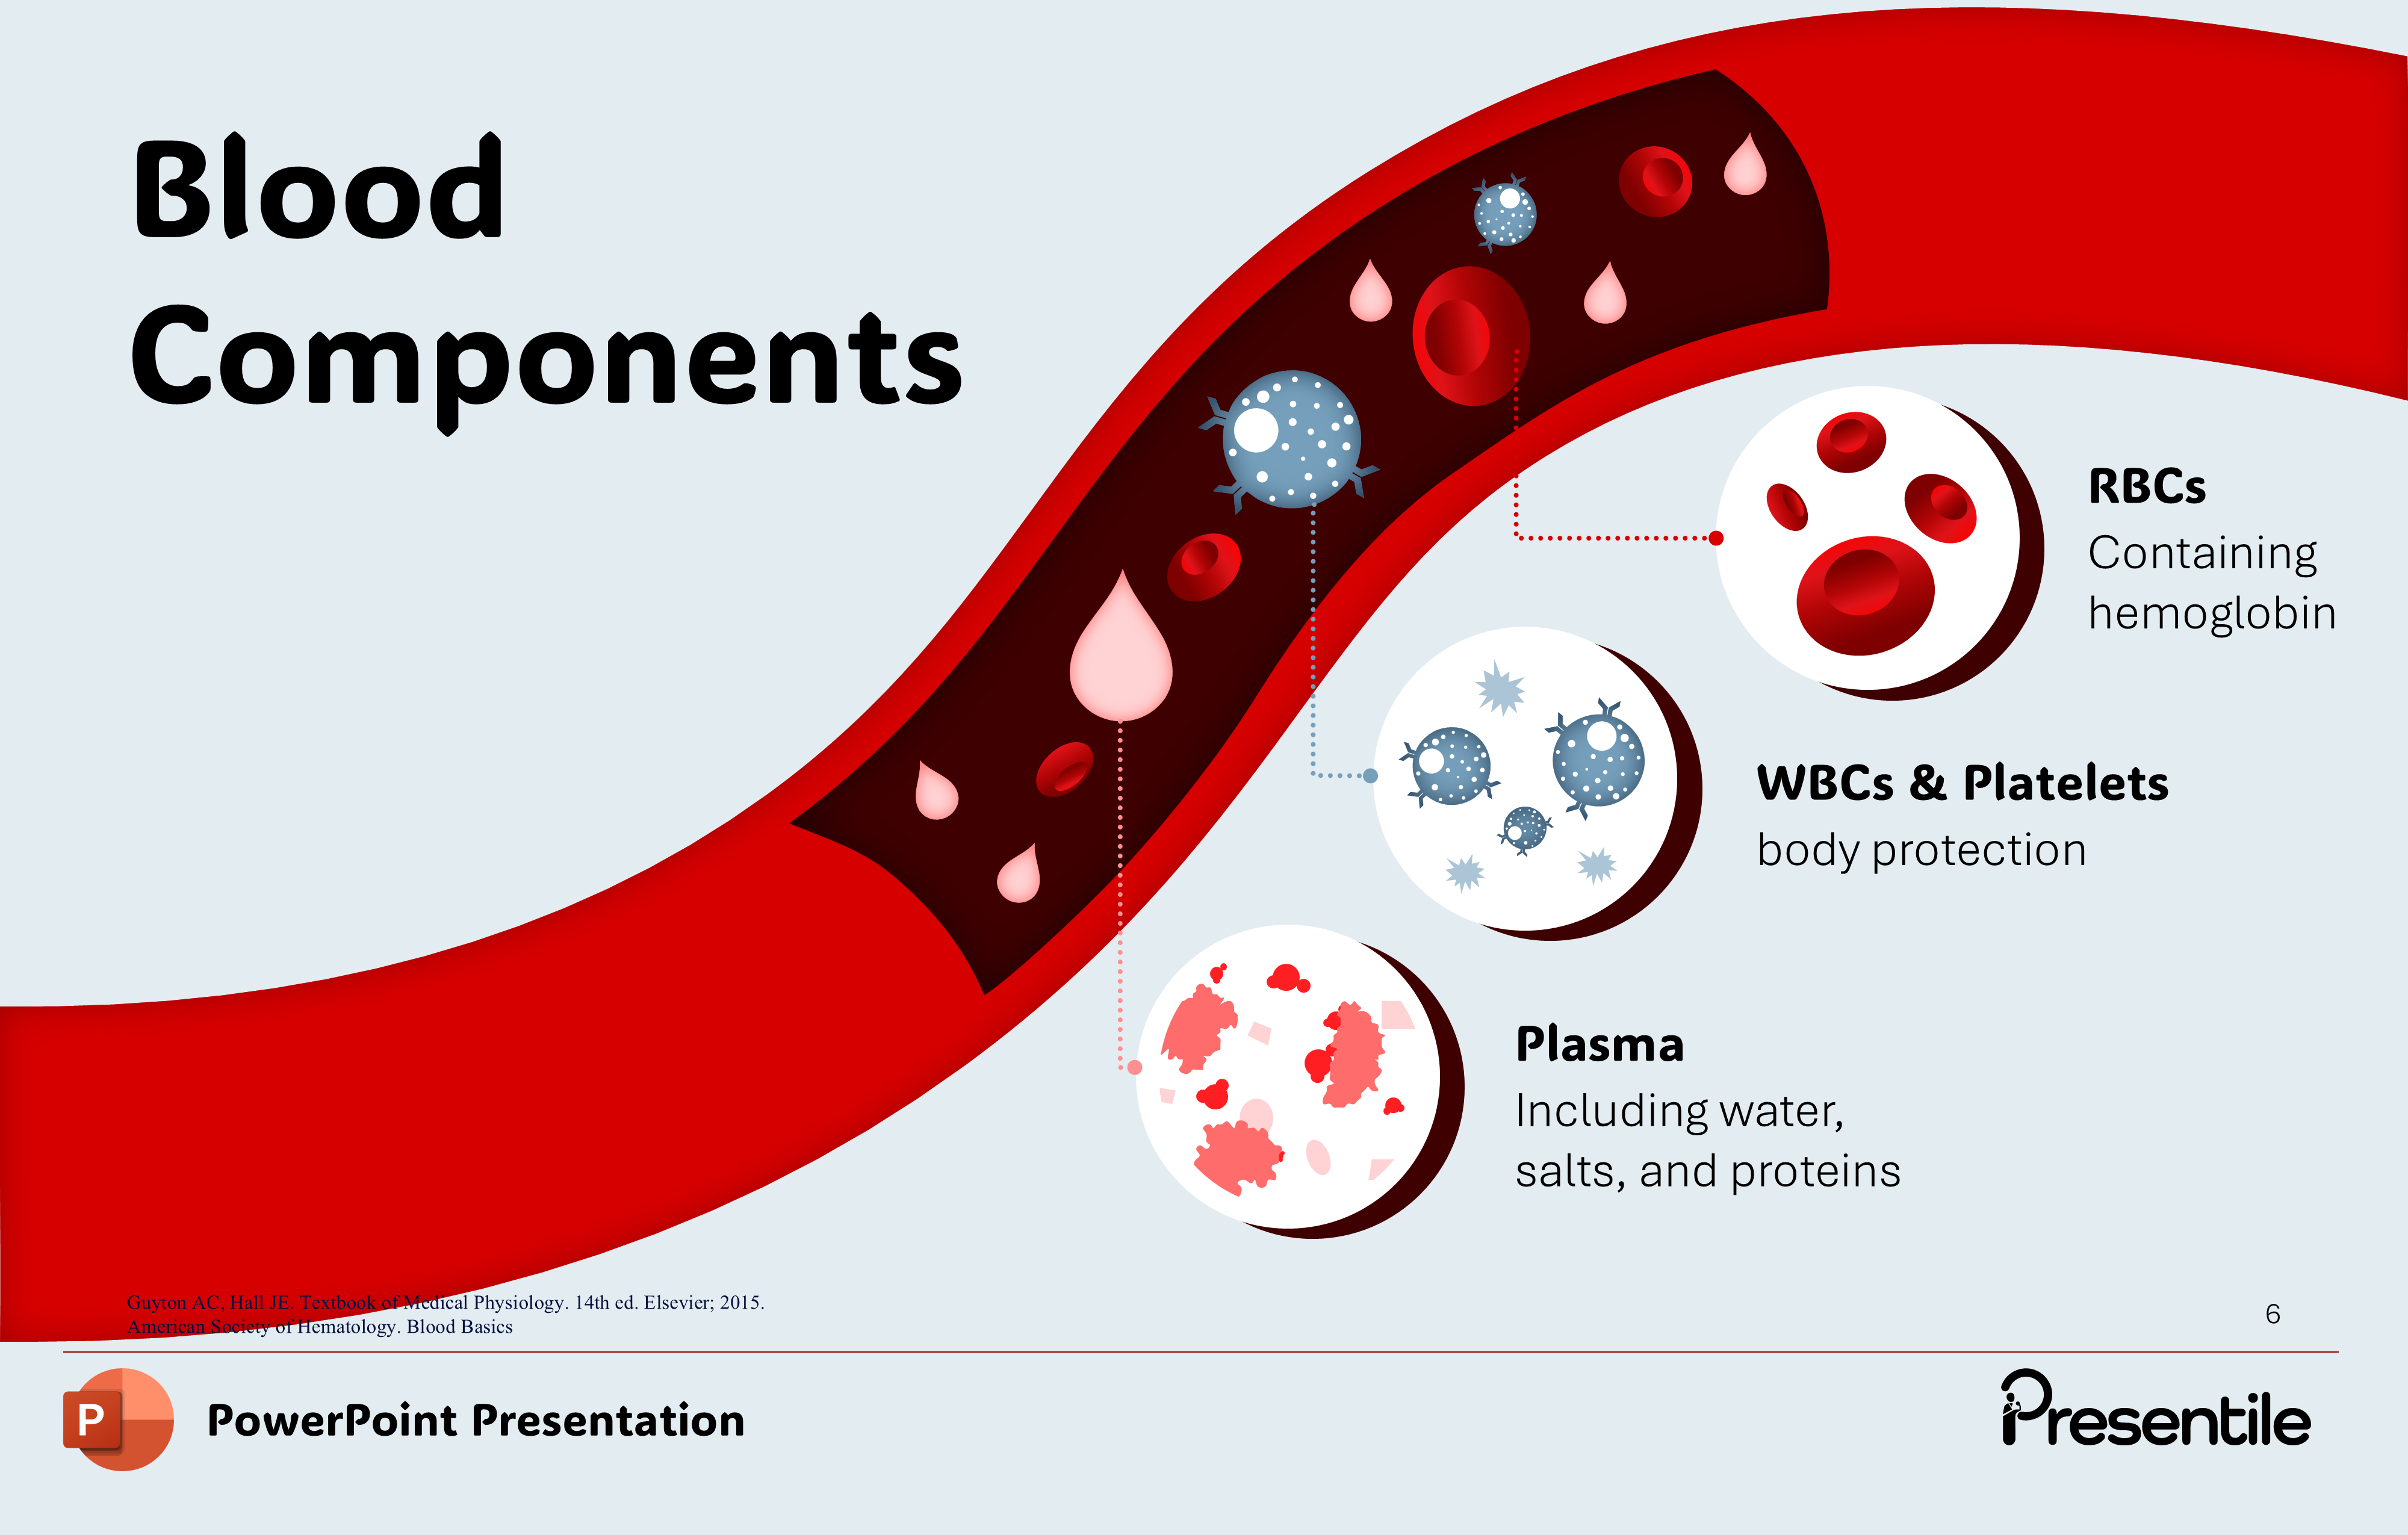
- Blood consists of four key components. Red blood cells, or RBCs, contain hemoglobin for oxygen transport.
- White blood cells and platelets work together to protect the body from infection and control bleeding. Plasma—the liquid portion—carries water, electrolytes, and vital proteins throughout the circulatory system.
- Together, these components maintain homeostasis and support all bodily functions."
Slide 7: Section Slide Red Blood Cells Structure

- Red blood cells have a unique biconcave structure—flattened discs with depressed centers.
- This is a Section slide
Slide 8: Hemoglobin Structure Subunits and Heme Function

- Hemoglobin is a protein found in red blood cells, and consists of four heme groups. each heme group contains an iron molecule that binds oxygen, giving hemoglobin its ability to deliver oxygen to the tissues.
- The Slide displays a red blood cell connected to the hemoglobin structure, highlighting the α and β subunits. It features a magnified view of the heme group, showing its iron-centered chemical structure.
Slide 9: Normal Hemoglobin Ranges by Age and Gender

- Hemoglobin levels vary based on factors like age, sex, and pregnancy status. For men, the normal hemoglobin range is between 13.5 and 18 grams per deciliter. For women, it’s slightly lower, ranging from 12 to 15 grams per deciliter. Children typically have a range from 11 to 16 grams per deciliter. During pregnancy, hemoglobin levels are often higher, with a normal range of over 10 grams per deciliter. These values are essential in diagnosing and managing conditions like anemia, where hemoglobin levels may be outside of the normal range.
- The Slide shows a red blood cell illustration next to a test tube, with blue human icons representing men, women, children, and pregnancy. It presents clear numeric ranges for each group using a simple, bold layout.
Slide 10: Oxygen Transport by Red Blood Cells A Step-by-Step Overview
- The process of oxygen transport begins in the lungs, where oxygen enters the blood and binds to hemoglobin in the red blood cells forming oxyhemoglobin. As blood circulates to tissues and organs, oxygen is released from hemoglobin and delivered to tissue cells. This process is vital for maintaining cellular functions and overall body metabolism.
- This Slide uses a red blood cell illustration showing oxygen molecules entering from the lungs, binding as oxyhemoglobin, and then releasing into tissues. Yellow arrows and circular oxygen markers highlight the oxygen flow.
Slide 11: Bone Structure and the Role of Bone Marrow

- The bone is composed of two main types of tissue: spongy bone and compact bone. Spongy bone, also known as cancellous bone, has a porous structure. Compact bone, on the other hand, is dense and forms the outer layer of the bone. Within the bone, especially in the cavities, is bone marrow, a soft tissue that plays a important role in hematopoiesis—the process of creating blood cells. Bone marrow is responsible for producing red blood cells, white blood cells, and platelets, which are essential for oxygen transport, immunity, and clotting in the body.
- This shows a cross-section of a long bone with distinct layers: spongy bone with a honeycomb texture, dense compact bone, and red bone marrow highlighted in color. It uses dotted lines and labels for clarity.
Slide 12: Stimulating Red Blood Cell Production in Hypoxia

- When the body experiences low oxygen levels, a process called hypoxia, the body activates the Hypoxia-Inducible Factor (HIF), which adjusts to these conditions.
- The slide shows kidneys with HIF activation in hypoxia and a yellow-highlighted bone structure producing blood cells. It uses arrows and oxygen markers to explain the role of oxygen sensing in stimulating erythropoiesis.
Slide 13: EPO Gene Activation Role of HIF in Red Blood Cell Production

- In response to hypoxia, HIF becomes active and binds to specific regions of the DNA near the erythropoietin (EPO) gene.
- The Slide shows kidneys with HIF markers connected to a DNA icon, representing EPO gene activation. The bone image on the side highlights bone marrow as the site of red blood cell production.
Slide 14: EPO Production in Kidneys Triggered by Hypoxia

- This binding triggers the activation of the EPO gene, causing the production of erythropoietin.
- kidney structures with the EPO hormone highlighted, linked to the bone illustration. It emphasizes the connection between kidney signaling and red blood cell production through simplified, clear diagrams.
Slide 15: Erythropoietin Stimulates Red Blood Cell Production

- Erythropoietin is then released into the bloodstream, stimulating the bone marrow to produce red blood cells, ensuring that the body can efficiently transport oxygen to tissues and organs.
- The slide illustrates a kidney releasing EPO in response to hypoxia, with the hormone traveling to the bone marrow, stimulating red blood cell production. Red arrows and dots illustrate the hormone’s journey from the kidneys to the bone marrow.
Slide 16: Erythropoiesis Process Red Blood Cell Development from Bone Marrow to Bloodstream

- Erythropoiesis involves several stages, starting with the megakaryocyte erythroid progenitor, which is the earliest identifiable precursor to red blood cells. As the process progresses, the cell undergoes several key stages: the proerythroblast stage, where the cell begins to specialize in red blood cell formation; the early erythroblast, where hemoglobin production begins; the intermediate erythroblast, which continues the development of hemoglobin; and the late erythroblast, where nuclear extrusion occurs. Finally, the reticulocyte is the immature red blood cell that enters circulation, where it matures into a fully functional red blood cell. This entire process is tightly regulated to ensure an adequate supply of red blood cells to meet the body’s oxygen transport needs.
- A cross-section of bone marrow where red cell precursors develop, moving through labeled stages. Arrows trace the flow of cells from the marrow into the bloodstream, illustrating the transition from immature to mature red blood cells.
Slide 17: Causes and Mechanisms of Anemia

- Three primary mechanisms can cause anemia: acute or chronic blood loss; increased red blood cell destruction, as seen in hemolytic disorders like sickle cell disease; and impaired RBC production, which occurs in nutritional deficiencies or bone marrow failure. Each pathway disrupts oxygen delivery uniquely, leading to anemia.
- Illustration of a human figure with scattered red blood cells, alongside labeled sections explaining anemia causes. Icons depict blood loss from a wound, RBC destruction by the immune system, and decreased production in bone marrow.
Slide 18: Anemia Classification Hypoproliferative vs. Hyperproliferative

- Reticulocyte count splits anemia into hypoproliferative (<2%, poor production) and hyperproliferative (>2%, active response)—a first diagnostic step for anemia.
- Featuring a human silhouette with red blood cell icons, bar charts, and reticulocyte icons. It contrasts low and high reticulocyte production using bold arrows and percentage labels.
Slide 19: Hypoproliferative Anemias Microcytic, Normocytic, and Macrocytic Types

- Microcytic anemias feature RBCs smaller than normal. Normocytic anemias maintain normal RBC size but reduced numbers. Macrocytic anemias involve enlarged RBCs. This size-based classification directs targeted diagnostic testing.
- Three magnified RBC samples labeled Microcytic, Normocytic, and Macrocytic. Color-coded cells depict size differences, with clear diagrams helping to differentiate each anemia type.
Slide 20: Anemia Classification by Cause

- Anemia is systematically classified by proliferative response and RBC size. First, hypoproliferative microcytic anemias—featuring small RBCs—include iron deficiency, the most common global cause, and thalassemias with their characteristic hemoglobinopathies. Next, hypoproliferative normocytic anemias encompass anemia of chronic disease, driven by inflammatory cytokines, and aplastic anemia from bone marrow failure. The hypoproliferative macrocytic group involves vitamin B12 or folate deficiencies impairing DNA synthesis, alongside refractory anemias. Finally, hyperproliferative hemolytic anemias split into extravascular hemolysis, where macrophages destroy RBCs, and intravascular hemolysis with direct blood stream rupture—each requiring distinct management.
- Cell illustrations and labeled sections for each anemia type, with arrows linking causes like iron deficiency, thalassemia, and hemolysis. Circular icons highlight key features for clarity.
Slide 21: Recognizing Common Warning Signs of Anemia

- Anemia presents through a spectrum of symptoms directly tied to oxygen deprivation. Early signs include weakness—the most common complaint—along with pale skin, dizziness, and short breaths. As severity progresses, patients develop chest pain resembling angina due to myocardial hypoxia. Neurologic manifestations like restless legs syndrome—may also occur.
- Features illustrated figures showing symptoms like weakness, dizziness, and pale skin. Each symptom is labeled with a corresponding icon or visual cue for clarity and easy recognition.
Slide 22: End of Presentation Slide for Anemia

- The closing slide serves as a polite conclusion to the presentation, signaling the end of the session.
- The slide features bold white “Thank You” text on a red background, with red blood cell icons scattered across the slide.
Features of
Introduction to Anemia PowerPoint Presentation
- Fully editable in PowerPoint
- All graphics are in vector format
- Medically Referenced information and data
Specifications
 Slides count:
 Compatible with:Microsoft PowerPoint
 File type:PPTX
 Dimensions:16:9
Files Included
- Non-animated PowerPoint
- Animated PowerPoint File
- Animated PowerPoint with Voice Over
- PDF Documents with presentation script
Elevate Your Work with Our Innovative Slides
Thank you! Your submission has been received!
Oops! Something went wrong while submitting the form.
No items found.