Medical Presentations
Cardiology
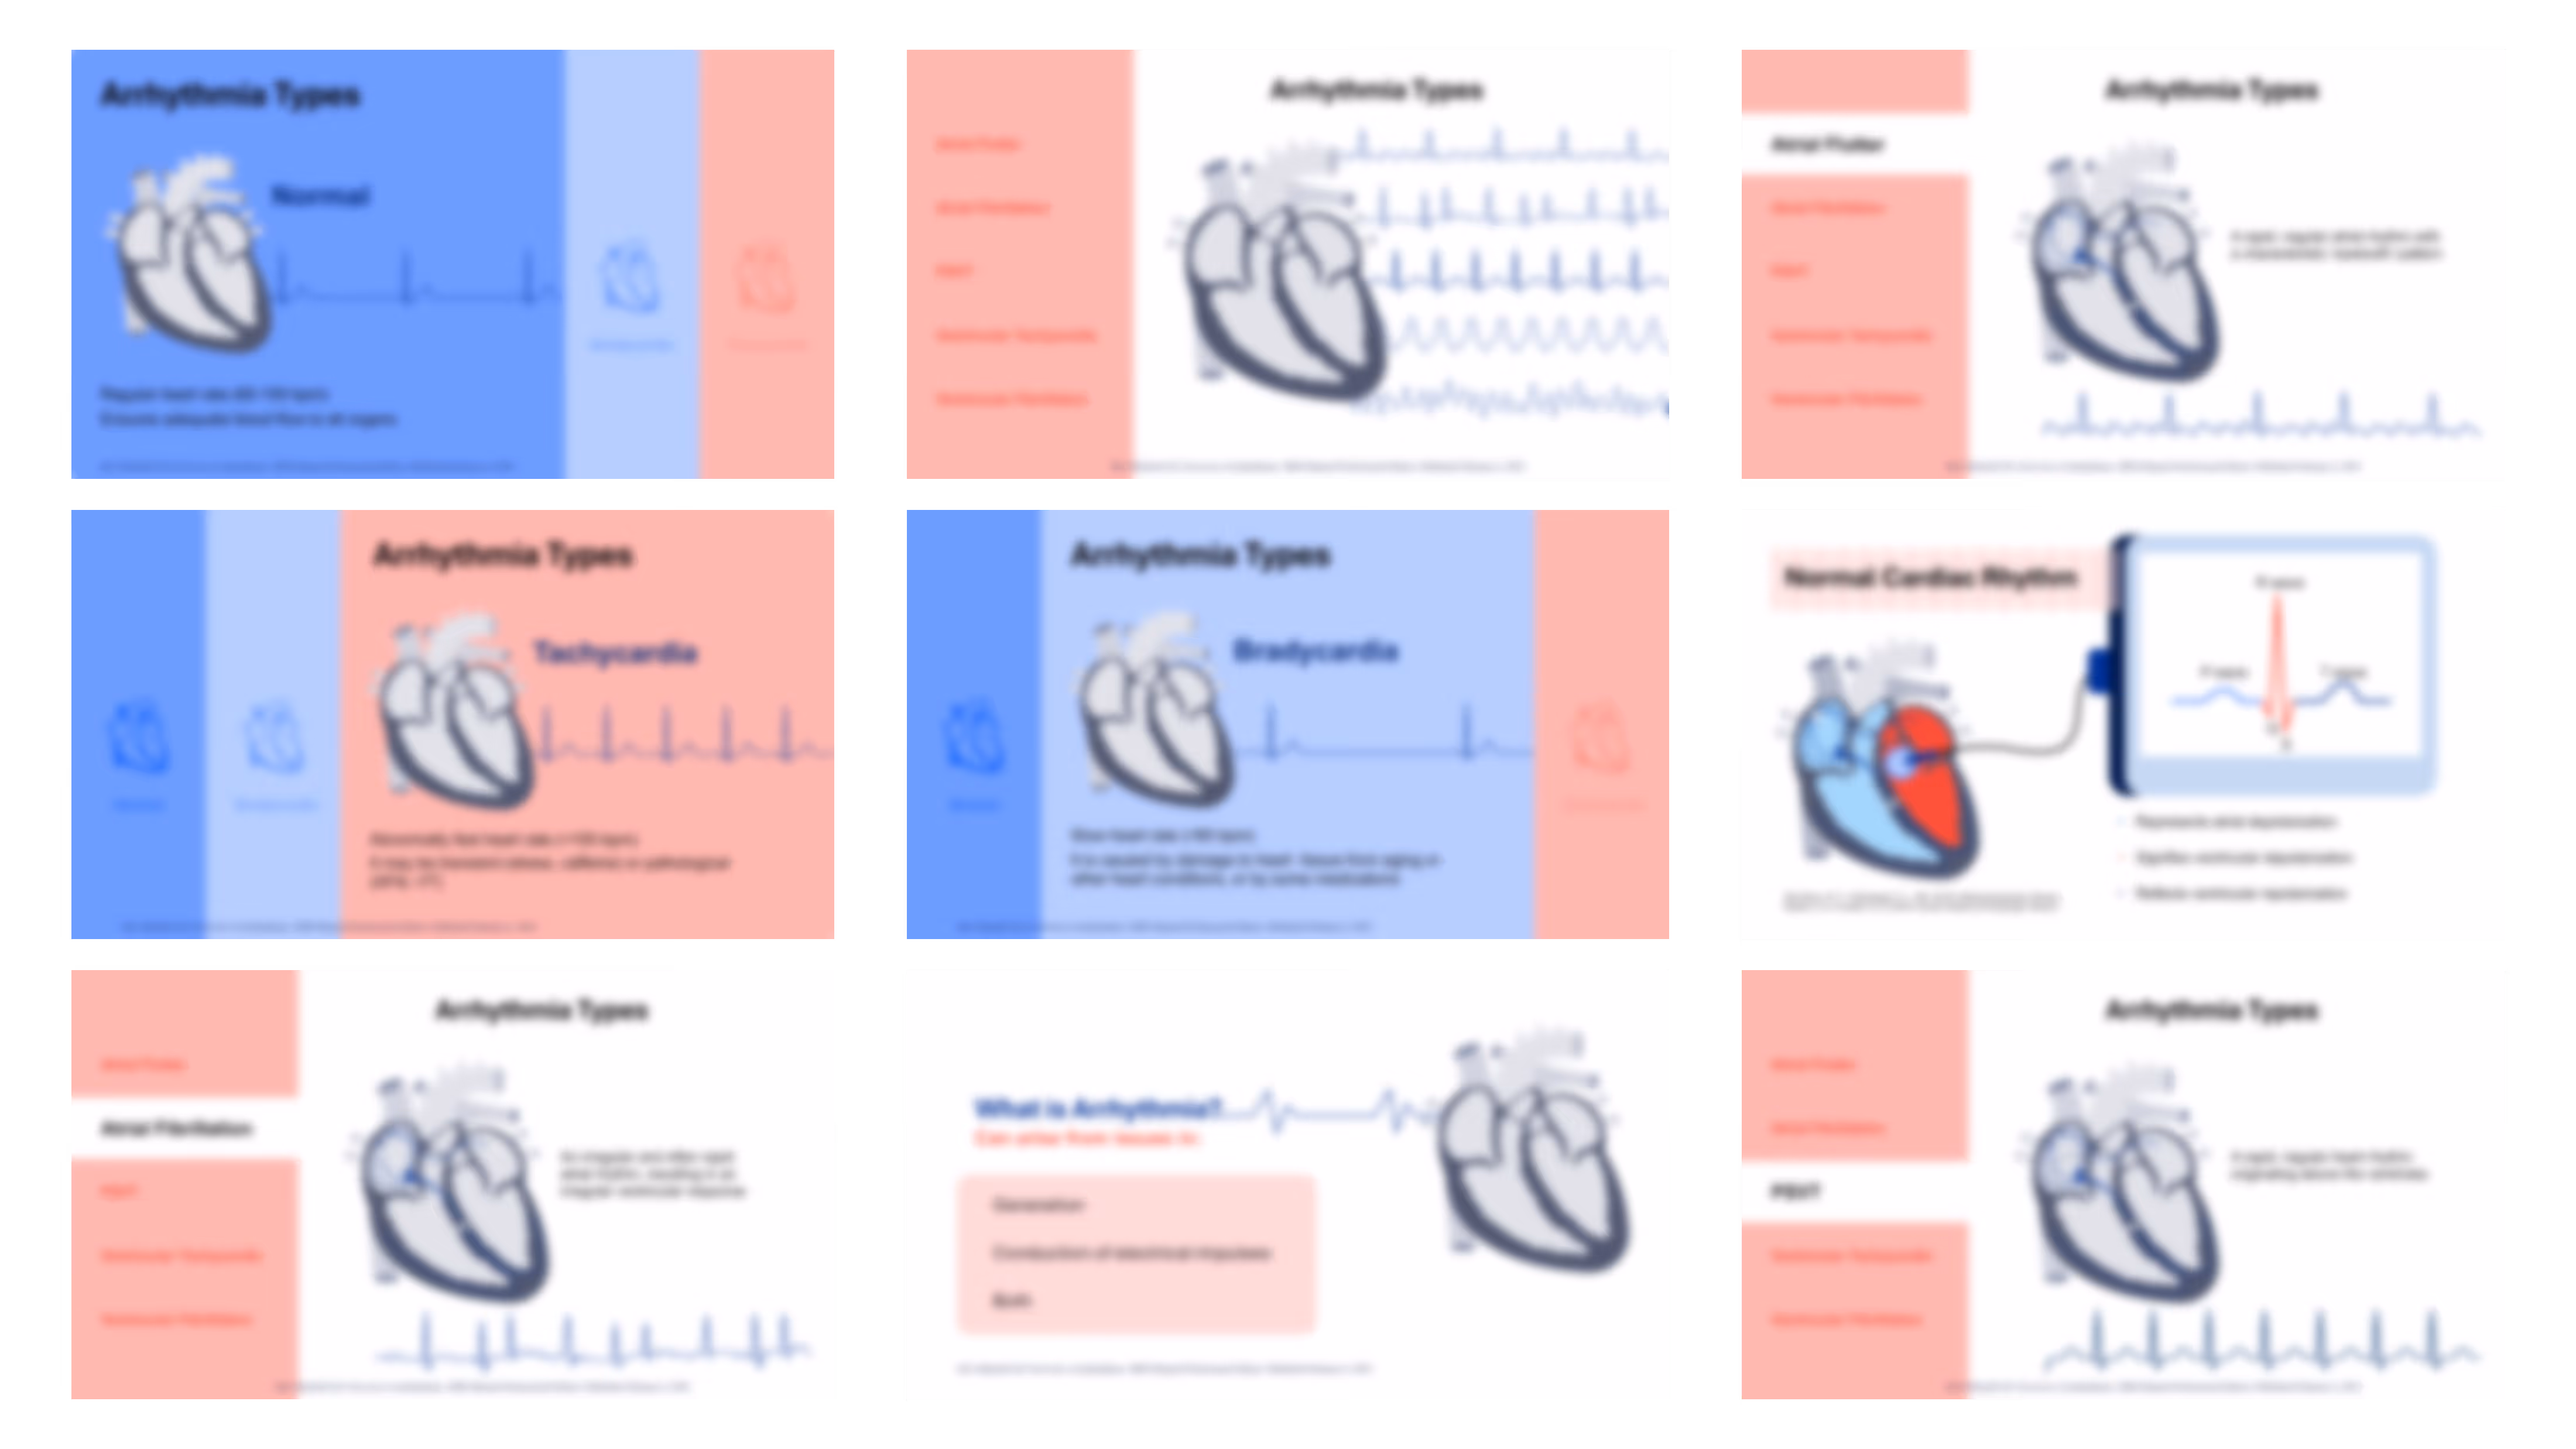
Arrhythmias Presentation
No items found.
Trusted By Life Scinece Teams:


Fully editable in PowerPoint with customizable colors, shapes, and layouts
For easy and friendly drag and drop
Fully animated slides
To help simplify and communicate complex medical concepts
All graphics in vector format
For crisp visuals at any size
Medically referenced information and data
Built by medical professionals and researchers who perfectly understand the science behind the slides
Life sciences–focused design
Tailored for pharma, biotech, and healthcare organizations
Price:
$ 29.00 USD
For pharmaceutical marketing teams and medical affairs teams

- who need to communicate complex cardiac information clearly and quickly, this presentation provides structured and professionally designed slides that reduce preparation time, improve message clarity, and ensure consistent storytelling across campaigns and presentations, with the option to update and customize the content based on your requirements, aligned with company guidelines, and with consultation support available to help adapt the presentation to your specific objectives.
For training managers, hospital education teams, and clinical training programs

- who need to deliver structured ECG and arrhythmia education without building content from scratch, this presentation offers ready-to-use material that simplifies complex concepts and ensures consistent learning across sessions.
For professors, academic lecturers, and universities

- who need to explain electrophysiology and rhythm disorders clearly, this presentation supports structured teaching, improves student understanding, and reduces preparation effort through an organized and adaptable format.
For healthcare professionals including cardiologists, emergency physicians, and internal medicine specialists
- who need to present diagnostic and treatment approaches efficiently, this presentation helps deliver clear, structured, and engaging content during conferences and clinical education sessions.
For researchers, biotech and medical device companies, and consultants
- who need to present technical or scientific content, this presentation provides a flexible framework that can be expanded and adapted for different audiences, projects, and communication goals.


No items found.